Blueprint · Quarries, aggregates & stone
Measuring what the cutting line actually produced
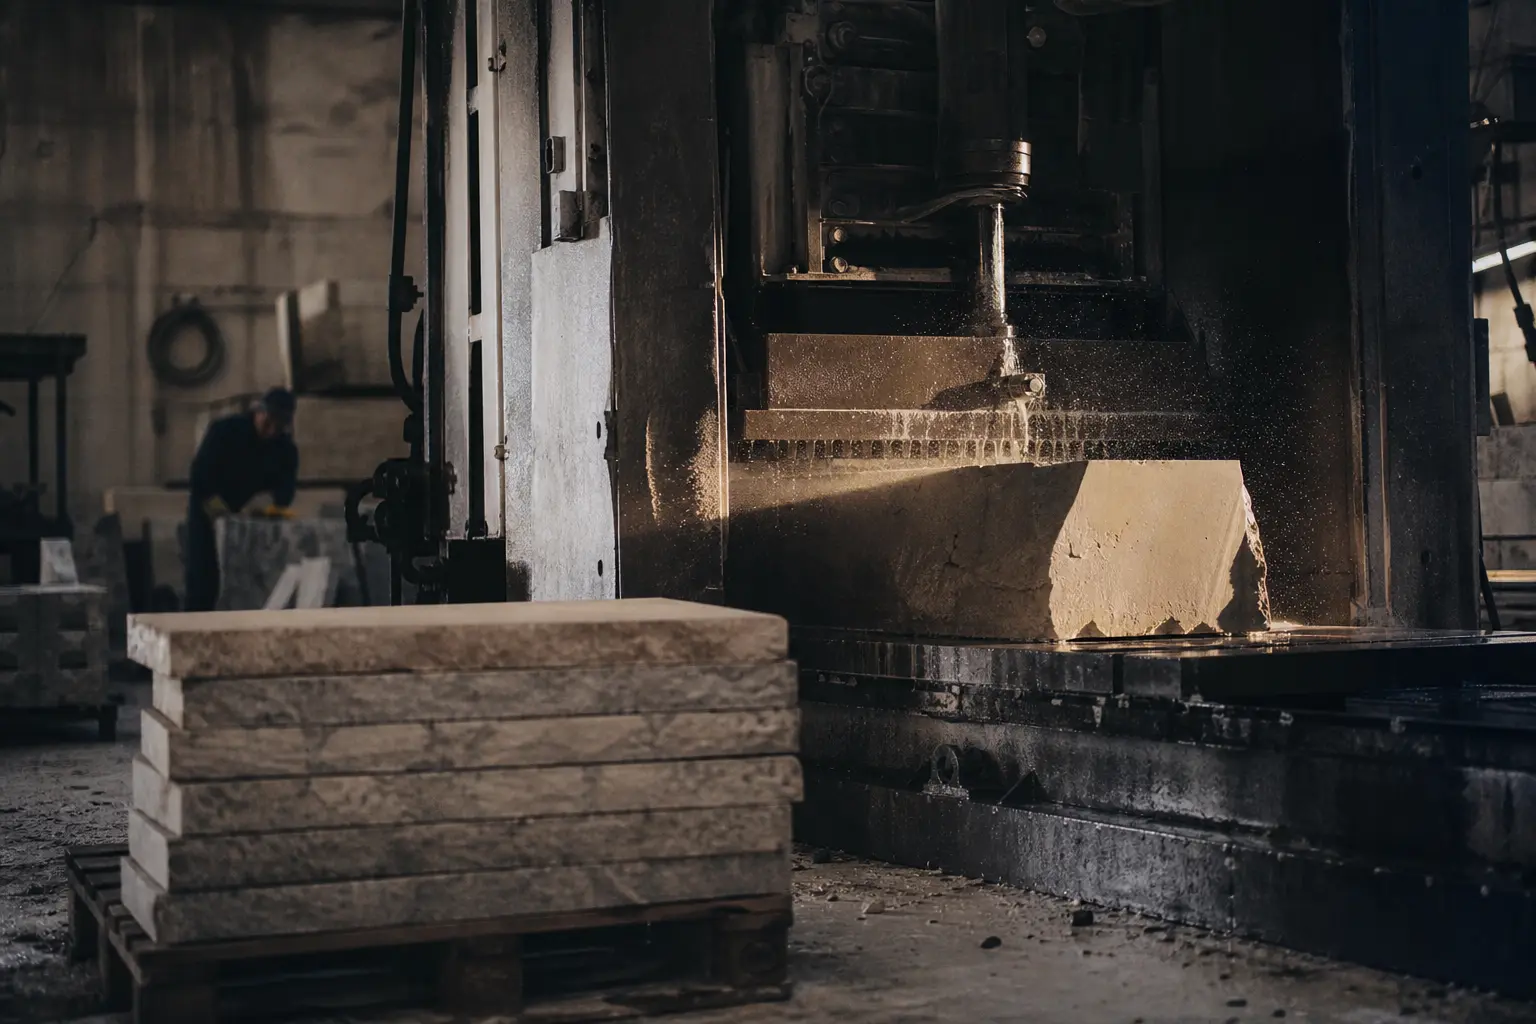
Camera-based piece counting, dimension measurement and tonnage estimation for stone guillotines and cutting lines — the production number no scale ticketing system produces.
Dimensional stone producer, guillotine and saw lines
How to read this
Deployment blueprint for the guillotine and cutting line module, based on a scoped quarry engagement. Accuracy targets are agreed and calibrated during commissioning.
The situation
What we were dealing with
Quarries with guillotines and saws know what left the yard because the scale tells them. What they do not know is what the cutting line produced, how much became waste, how long each cycle took, or which operator and machine produced which output.
In practice production is logged as pieces on a clipboard, tonnage is estimated from block dimensions once in a while, or nothing is recorded at all. Cost per ton, margin per product and operator performance are therefore guesses.
No mainstream aggregate software covers this, so the gap simply persists.
- Per piece
- Counted, sized and weight-estimated automatically
- Per shift
- Waste percentage, cycle time and output per operator
- Edge
- Runs on-site, so poor pit connectivity is irrelevant
Approach
What we built, in order
- 01
Line assessment and metric selection
Machines, layout, lighting and existing logs are assessed, and we agree the handful of metrics that will actually change decisions: tonnage, waste, cycle time, output per operator.
- 02
Camera kit and on-site compute
Industrial cameras, mounting and enclosures are specified and installed, with an edge device doing the processing locally so the system works without reliable connectivity.
- 03
Detection, measurement and estimation
Each produced piece is detected and measured, classified by size or grade, and converted to estimated weight using material density; waste is derived from input block volume versus output.
- 04
Calibration against the scale
Estimates are compared with real weighings until they fall inside an agreed tolerance, and recalibration is repeated when materials or setups change.
- 05
Reporting and maintenance signals
Shift reports, operator productivity and cost-per-ton views are generated automatically, and cycle-time drift raises maintenance alerts before a blade or hydraulic problem stops the line.
Outcome
Where it landed
- Production recorded automatically per machine, operator and shift with no clipboards
- Waste percentage and cycle time visible for the first time, per material
- Cost per ton and margin per product built on measured output rather than estimates
- Maintenance alerts driven by measurable slowdown instead of breakdown
- Cut output linked into inventory so finished stock reflects reality
Modules used
The systems behind this
Document automation
AI document automation that reads fiscal notes, scale tickets, invoices and statements from email, PDF or a phone photo, validates them, and pushes structured data into your sheets and accounting system.
From $3,000 setup + $250 / monthProduction intelligence
Automated production tracking, tonnage estimation from vision, daily production reports and inventory logic for yards, quarries, cutting lines and plants.
From $7,500 setup + $500 / monthMore
Other deployments
Five brands, one automated back office
A group running five consumer and industrial brands replaced spreadsheet reporting, manual support drafting and lost voicemails with a single automation layer across every storefront.
Read the detail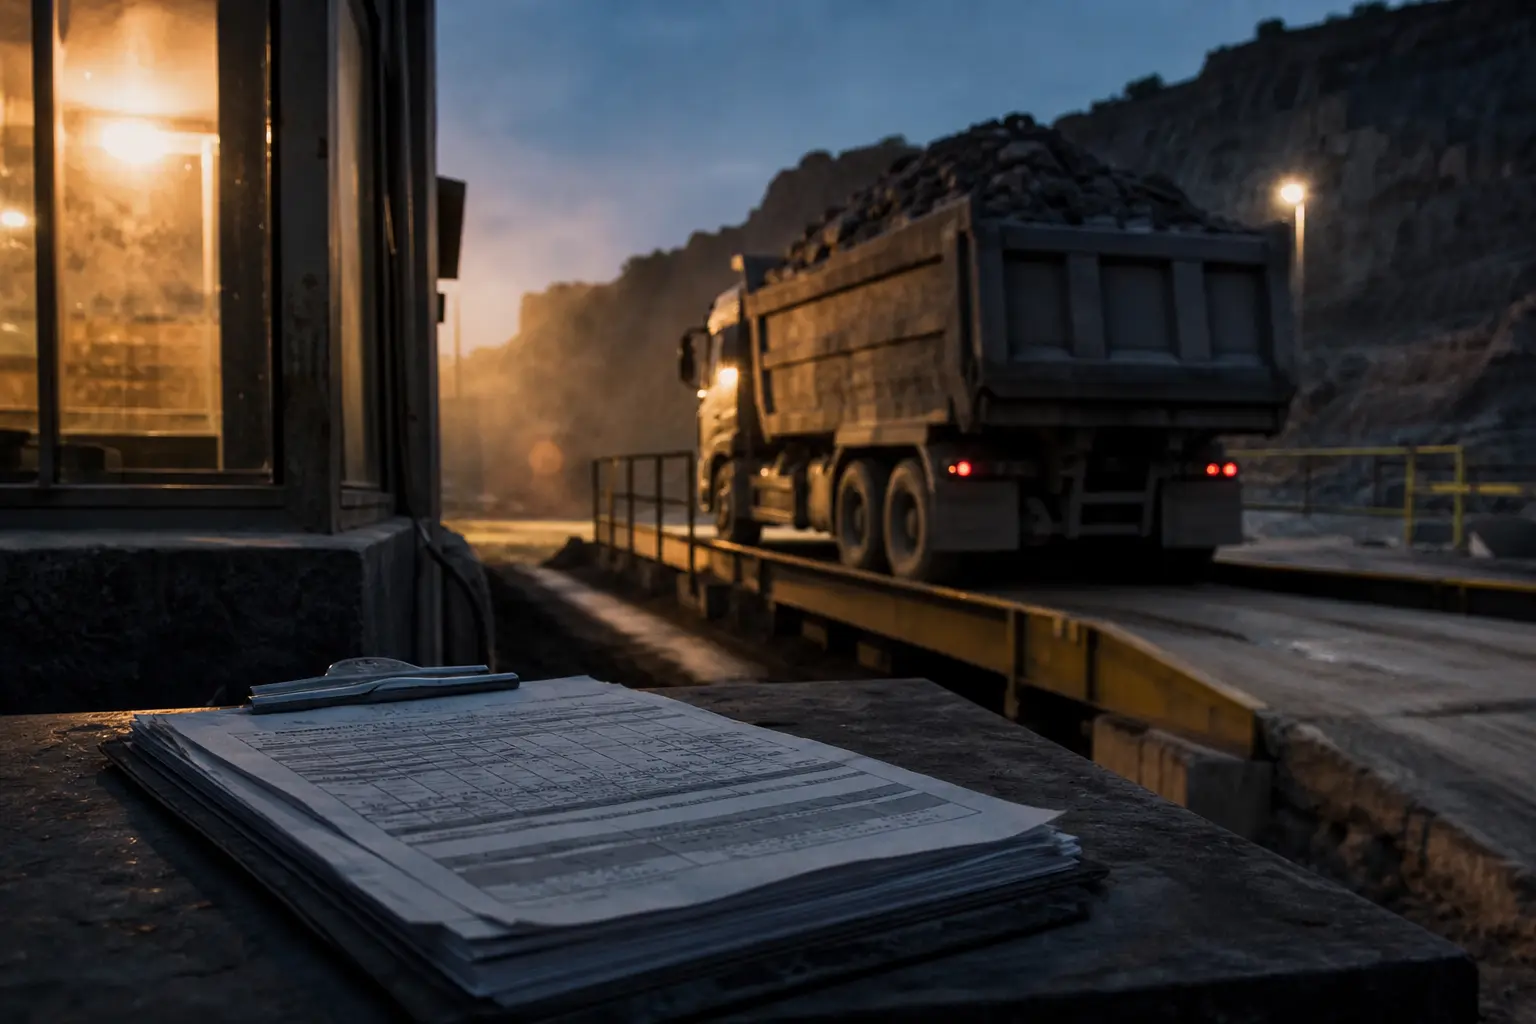
From fiscal notes and Excel to same-day billing packets
How a quarry running on fiscal notes, email and spreadsheets gets to automated ticket capture, daily reconciliation and invoice-ready batches without touching its scale house software.
Read the detail
Every document filed, every renewal caught
Tax letters, utilities, insurance renewals and vendor invoices routed automatically to the right property, with deadlines extracted and reminders sent before anything is due.
Read the detailBook a 30-minute automation audit
Bring one workflow that eats your week — calls you miss, documents you retype, reports you rebuild. We will map it, tell you what it costs to automate, and what we would do first.